Battery and Energy Technologies |
|
A Software Configurable Battery
Battery Performance Improvement by Electronic Means
Increased Battery Cycle Life and Reliability by Means of "Rest Periods" and "Cyclic Redundancy"This page shows how major improvements in battery performance can be achieved by incorporating Rest Periods and Cyclic Redundancy into a Software Configurable Battery. Allowing regular rest periods during both charging and discharging enables battery cycle life to be extended by between 20% and 30%. Cyclic redundancy enables the implementation of the rest periods without interrupting the battery power delivery while at the same time increasing battery reliability by over 1000 times. Significant further benefits can be achieved by means of software alone without adding any hardware and these are outlined in the paper below which was recently presented to EVS26, The International Battery, Hybrid and Fuel Cell Electric Vehicle Symposium in the USA.
Download a PDF copy of this paper EVS26 A Software Configurable Battery Chairman of CHEEVC Ltd, Aberdour, Scotland, blawson@cheevc.com Keywords: battery calendar life, charge equalization, dynamic charging, power management, reliability
Abstract A switching matrix provides controlled access to individual cells and an extra cell in the battery string provides redundancy. The redundant cell is bypassed and rested while remaining cells carry the load. The rest periods reduce the stress on the cells resulting in increased battery lifetime and also charge capacity. Sequential cycling rests each cell in turn so that all cells in the battery age at the same rate. The package of benefits includes increased cycle life, increased capacity, lower cost per cycle, variable coarse and fine power output directly from the battery, lossless cell balancing during both charging and discharging, more accurate State of Charge (SOC) estimation, immunity to single cell failures and the possibility to deliver a short term power boost.
The rate at which a battery or cell can be charged or discharged is limited by the rate at which the active chemicals in the cells can be transformed. Forcing high currents through the battery results in incomplete transformation of the active chemicals reducing the battery’s effective charge capacity and it also causes unwanted, irreversible chemical reactions to occur because the chemical transformations cannot keep up with the current demands [1]. The unwanted chemical transformations consume some of the active chemicals causing the battery to lose capacity and thus age prematurely. Examples of this performance degradation are shown in the following section with an explanation of the causes. The object of the CHEEVC design was to find a way of reducing this inherent performance degradation at high energy throughput rates. It is well known that increasing the rate at which a battery operates results in a reduction in capacity and conversely, reducing the rate of current draw results in increased capacity. The graph Fig. 1 below which shows discharge curves for an 8 Ah cell is typical for Lithium Ion cell chemistry and demonstrates this effect.
Figure 1:
The capacity reduction at high discharge rates occurs because the transformation of the active chemicals cannot keep pace with the current drawn. The result is incomplete chemical reactions and an associated reduction in capacity. This may be accompanied by changes in the morphology of the electrode crystals such as cracking or crystal growth which adversely affect the internal impedance of the cell. Similar problems occur during charging. There is a limitation as to how quickly the Lithium ions can enter into the intercalation layers of the anode. Trying to force too much current through the battery during the charging process results in surplus ions being deposited on the anode in the form of Lithium metal. Known as Lithium plating, this results in an irreversible capacity loss. At the same time, maintaining the higher voltages needed for fast charging can lead to breakdown of the electrolyte which also results in capacity loss.
From the above we can expect that with each charge/discharge cycle the accumulated irreversible capacity loss will increase. Although this may be imperceptible, ultimately the capacity reduction will result in the cell being unable to store the energy required by the specification. In other words it reaches the end of its useful life and since the capacity loss is brought on by high current operation, we can expect that he cycle life of the cell will be shorter, the higher the current it carries. The graph Fig.2 by Choi et al [5] demonstrates that this is the case in practice.

Figure 2:
As already noted, the rate at which current can be pushed into or drawn from a cell depends on the rate at which the charging or discharging chemical transformations take place. Chemical reactions cannot take place instantaneously. There are different reaction gradients between the ions close to the electrodes and those further away and also within the electrodes themselves due to the time it takes for the ions to progress through the cell and there are three distinct time constants associated with these ion flows [6]. These are shown in the diagram Fig.3 and explained below.
Figure 3: Source: Electropaedia 1 Charge transfer / Chemical conversion at the electrode surface. Chemical conversion of the ions close to the surface of the electrodes occurs very quickly and this reaction has a short time constant. The maximum current, consistent with complete transformation of the active chemicals, which can pass through a cell is thus limited by the rate of the ion flow through the cells and the reaction time at the surface of the electrodes. Longer reaction times are more noticeable in high capacity cells which tend to be physically very large. High pulse currents may be possible, accommodated by the ions close to the electrode surface but continuous currents will be limited to a lower value due to the longer time it takes the ions to reach the active electrode crystals and to percolate through the crystal lattice. The introduction of “rest periods” during charging and discharging allows more time for the chemical transformations to take place and for the reaction to stabilise thus avoiding the problems associated with incomplete transformation of the active chemicals. Reaction rates are of course also temperature dependent and the maximum current flow is also limited by the rate of heat dissipation in the cell. Rest periods provide time for completion of the ion transportation and the chemical reactions to stabilise (Also known as quiescent recovery). They allow recovery time during both charging and discharging thus reducing the stress on the cells, increasing charge capacity and avoiding unwanted chemical reactions allowing increased cycle life. They also allow more accurate SOC estimation. While the problems of ion transportation and transformation apply in principle to all battery chemistries; and despite the fact that it has been known for some time battery performance may be enhanced by the use of rest periods, nobody has applied it in a controlled way to increase the cycle life of the cells. We need to know whether this technique can be implemented in practical batteries and whether it will be cost effective. For this, two experiments were set up, the first to determine the potential cycle life improvement and the second to determine the Coulombic efficiency as well as to determine the optimum duration of the rest periods and to confirm the application in a working battery. Tests were carried out on individual cells as well as on complete packs designed with 1 for 7 redundancy. That is 7 active cells and 1 stand-by cell. In all experiments, the industry standard method of battery cycling was used to charge and discharge sample cells or complete batteries according to the manufacturer’s specifications. The cycling equipment shown in Fig 4 below incorporated programmable power supplies to charge the cells using a constant current-constant voltage charging profile and loads to discharge the cells. Cell voltage was continuously monitored and the cell capacity was determined by Coulomb counting. (Integrating the current over time).
Figure 4: Cycle Tester
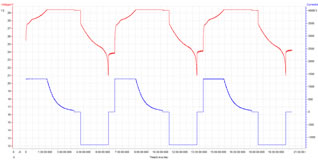
The chart Fig. 5 below is a printout from the cycling equipment showing cell terminal voltages and currents during a typical charge/discharge cycle.
Figure 5: Test Charge - Discharge Cycle
Note that the duration of the charge is around 4 hours and the discharge period is about 2.25 hours. Following the cell manufacturer’s specification there is a rest period of 30 minutes at the end of each charge and another at the end of each discharge period when the cells are disconnected from the power supply or the load. This is to allow the battery to approach equilibrium and to cool down so that each cycle effectively has a fresh charge avoiding the accumulation of partially transformed chemicals and the build up of temperature. This long recovery period applied to both the tests with the programmed rest periods and also to the control group without the programmed rest periods. For the test, the intention was to rest the cells for short periods during both the charging and discharging periods. Rest periods ranged from 0.1 seconds every 0.8 seconds to 10 seconds every 80 seconds. Unfortunately, because of equipment malfunction, it was only possible to apply the rest periods during discharging. (Life tests being repeated on new equipment. Early indications confirm expectations)
Tests were performed with 18650 Lithium ion cells to verify and quantify the expected cycle life improvement made possible by the introduction of rest periods. A batch of 1000 X 18650 cells with a specified capacity of 2,400 mAh and cycle life of 300 cycles was purchased directly from a well known manufacturer. Two sample batches of 48 cells were selected randomly from the 1000 cells, one group for cycling with rest periods, the other, a control group, for cycling in the normal way without rest periods.
Figure 6: Increase in Cycle Life Due to Rest Periods
Histograms showing the number of cells with each level of capacity are shown in Fig.6 above. One surprising result was the spread of capacity at the actual beginning of life (BOL) of the new cells and the shape of the distribution, shown in the top 2 histograms. The cell manufacturer gave assurances that this was normal so it was discounted for the purposes of these tests. The graphs show that by applying rest periods during discharge alone, the cycle life of the cells can be increased by 20%. We can expect a similar improvement by introducing rest periods during charging, since the principle involved is the same however as noted above, further tests must be carried out to confirm this.
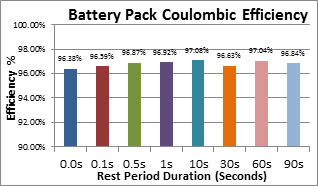
The second test had two objectives: 1) To measure the Coulombic efficiency of a battery pack resulting from the introduction of rest periods. 2) To determine the optimum duration of the rest periods. Although the Coulombic (round trip) charge / discharge efficiency of a Lithium ion cell is close to 100% (Actually 99.86% for the cells used in these tests), when the cells are incorporated into a battery pack, the energy consumed by the associated battery management system (BMS) and the cell balancing circuits can affect this significantly. For a typical low power battery using eight 2400 mAh 18650 cells, the BMS and cell balancing could consume as much as 80 mA during operation. This amounts to an efficiency loss of 3.3%. These system losses are rarely quoted in battery specifications. The CHEEVC design is intended to work in conjunction with conventional BMS designs, but with lossless cell balancing replacing the dissipative cell balancing. See more about cell balancing in paragraphs 16 and 17 below.
The Coulombic efficiency of an 8 cell battery pack was determined, during three complete charge / discharge cycles, with and without rest periods by measuring the charge applied during charging and the stored capacity by discharging the battery. The charging profile and the charge discharge rates were the same as in the previous tests. The graph Fig 7 below shows the Coulombic efficiency of an 8 cell pack, including BMS, charged and discharged with different rest periods. A switching matrix (See paragraph 4) was used to implement the cycles with rest periods but not for the reference cycle. Figure 7: Coulombic Efficiency of an 8 Cell Battery Pack With and Without Rest Periods. It shows an increase in Coulombic efficiency due to the rest periods of around 0. 35%. This is in line with the increase in charge capacity predicted by the Peukert relationship. C = I n T where "C" is the theoretical (specified) capacity of the battery expressed in Amphours, "I" is the current, "T" is time, and "n" is the Peukert Number, a constant for a given battery. For Lithium cells “n” is typically 1.03 or less and this would result in a capacity improvement of 0.4% with a rest period ratio of 1 for 7. The graph also indicates that there is no further improvement by increasing the rest periods from 0.1 second to up to 90 seconds. It also shows that the overall Coulombic efficiency loss is not increased, from the expected 3% due to the BMS, by the addition of the switching matrix. This is partly due to the small improvement due to the Peukert effect, but mainly because the dissipative cell balancing is replaced with lossless balancing. While the introduction of rest periods can improve battery performance, the cost, or trade off, is intermittent energy flow which is unacceptable for most applications. Cyclic redundancy avoids this problem by enabling individual cells to be taken out of the battery chain and rested while at the same time a constant current into or out of the battery is maintained. In effect this means that the battery can operate at constant full power with the maximum instantaneous current that the cells are specified to carry, while the each of the cells which make up the battery actually carries a lower average current due to the effect of the rest periods. Key to the design is the provision of a stand-by or redundant cell and the switching matrix which allows each individual cell in the chain to be rested by switching it out of the battery chain in sequence to take its turn as the stand-by cell. The availability of the stand-by cell to replace a failed cell provides a major improvement in battery reliability. More importantly the introduction of rest periods for the cells during both charging and discharging reduces the stress on the battery during its use and this in turn brings improved cycle life as well as increased capacity of the battery. An alternative way of looking at this is to consider that the incorporation of rest periods is simply a method of reducing the average current through the cells which in turn reduces the stress on the cells. The provision of the redundant cell is a way of maintaining the full power output of the battery pack.
The switching matrix provides access to, and control of, individual cells in the battery chain. It provides rest periods by the sequential bypassing of individual cells and it allows software configurable features without adding any additional hardware. In the example Fig.8 below, one redundant cell is provided for seven active cells providing 1 for 7 redundancy. The switching circuit causes each cell to be sequentially cycled out of the active cell string thus allowing a rest period for each cell every 8 cycles. With minor additions, the switching matrix can be used to provide cell balancing or for variable power control. Since multiple cells may need to be bypassed, an extra switch in each bypass path, that is three switches per cell, may be needed as in Fig. 9 below.
Figure 8: The Switching Matrix Figure 9: Switching Matrix with 3 Switches per Cell A second drawback of conventional cell balancing is that it is usually only possible to carry it out when the battery is fully charged towards the end of its discharge cycle and only when the battery is not in use. Bypass currents are very low so that equalisation is a very slow process which may take many hours to complete. The lossless cell balancing described above is able to keep all cells at the same state of charge (SOC) at any level during both charging and discharging so that cells are balanced at all times during operation and not just when the battery is idle. Preventing cells from getting out of balance prolongs battery life even further. The ability to bypass multiple cells can be used to provide a variable power output directly from the battery. This facility can be used in some applications to avoid the costs and inefficiencies of separate power controllers. It is also useful as a soft start feature to control inrush currents in power circuits.
The accuracy of the SOC estimation is important in all EV applications. Like the gas gauge in a car, it provides an indication of the remaining range available from the energy left in the battery. In HEVs it may also be used to determine when the engine is switched on and off and so any errors could affect the vehicle’s fuel efficiency. SOC cannot be measured directly and for Lithium batteries it is usually calculated from Coulomb counting modified by an algorithm which takes into account the battery or cell voltage, the cell chemistry variant, the battery temperature, the rate of current draw and possibly other factors. But in all cases a major factor affecting the SOC calculation is the battery or cell voltage. The graph Fig. 10 below, often called the hysteresis curve of the battery, shows that the actual measured cell voltage depends on whether it was taken when the battery was being charged or discharged. This is because the measurement is affected by the external circuitry and the voltage drop across the battery as well as the time lag in reaching chemical equilibrium consistent with the current flow as discussed in paragraph 4 above.
Figure 10: SOC Hysteresis Curve
There can only be one state of charge, so the deviation from the central quiescent voltage line can introduce large inaccuracies. If the charging or discharging were stopped completely at any time during the cycle the cell voltage would migrate towards the quiescent central position between the charge and discharge curves as the chemical transformations stabilise. The graph also shows that when rest periods are introduced the measured cell voltage moves towards its quiescent condition during the rest periods. This is because the cell is in the open circuit condition during the rest period and the chemical transformations in the cell have time to complete. Thus, the cell voltage measured towards the end of the rest period will be much closer to the cell voltage corresponding to the true open circuit voltage of the cell and the measurement error introduced into the SOC calculation will be minimised. The availability of the standby cell needed for cyclic redundancy brings additional opportunities and benefits to the battery. The cyclic redundancy allows the full capacity of the extra cell to be used by the battery. With 1 for 7 redundancy this amounts to an extra increase in capacity of 14.3%. Thus the standby cell is fully occupied and does not reduce the battery energy density. As an alternative, smaller capacity cells could be used to provide a given battery capacity.
The extra, stand-by cell can be used in the conventional way to provide immunity to single cell failures, increasing the system reliability by bypassing or replacing a failed cell. In this case the cyclic redundancy would no longer be available but the battery would continue to function at full power until it could be serviced. This can be very important in mission critical and airborne applications. The more cells in the chain the less reliable the battery will be. For a battery constructed from 7 series cells each with a reliability of 99.99% per year or 1 failure in 10,000 batteries, the reliability of the battery will be 99.93% per year or 1 failure in 1,429 batteries. With 8 cells it will be 99.92% per year or 1 in 1,250 batteries.
Where k is the minimum number of components needed to keep the system functioning. As before with R=99.99% and n=8 and k=7 in a 1 for 7 system R is calculated to be 99.99994% per year or 1 failure in 1.67 million batteries. A dramatic improvement.
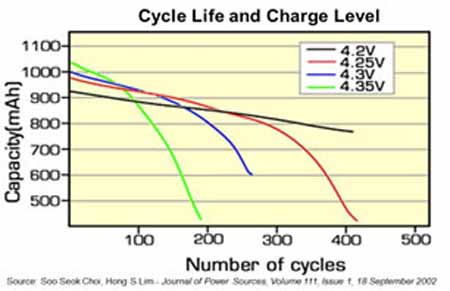
The standby cell can also be switched in to the battery chain to provide a time limited power boost of 30.6% in a system with 1 for 7 redundancy. However this will disable the cyclic redundancy and should probably only be used in an emergency. Providing rest periods is essentially a way of de-stressing the cells or the battery. There are other alternative ways of accomplishing this. Fig 11 by Choi [5] Shows how cycle life can be increased by reducing the charge level on the cells.
Figure 11: Cycle life and Charge Level But there are drawbacks to this solution. The number of cells must be increased in proportion to make up for the decreased cell capacity resulting from the lower charge level. The battery energy density is reduced since the cells are not used at their full capacity. Reliability is reduced because there will be more cells in the chain and a single cell failure will cause failure of the battery.
Figure 12: System Block Diagram
Though the initial applications are for electric bikes, the design can be scaled up in 2 ways to cater for high power applications. Higher power FET switches can be used. As the power requirement increases, the cost of the cells increases more quickly than the cost of the FETs improving the cost effectiveness of the design. However the downside is that such applications will require more sophisticated thermal management to cope with the increased heat dissipation of the higher power cells and the associated electronic circuits. By using higher power FETs current handling capacities of 400 amps are possible.
The histogram Fig 13 below shows a summary of the benefits compared with the alternative de-stressing method of reducing the cell voltage.
Figure 13: A Graphical Summary of the Benefits Extended battery life of over 20%. Achieved by the use of a switching matrix to provide rest periods during both charging and discharging. It uses an extra cell to enable cyclic redundancy of the individual cells in the battery chain. The use of rest periods in this way is unique technology for which a patent application was filed in November 2010. (A 20% improvement was demonstrated by applying rest periods during discharging only. 30% or more is possible when rest periods also applied during charging.) Reduced operating costs of 5% per cycle during the lifetime of the battery. A direct consequence of the extended life from the cells. (Taking into account the increased cost of the battery) Software controlled power output. Without any additional hardware, the switching matrix can be programmed to provide a variable voltage and current from the battery. No other battery has such a capability. This is also a unique technology which is also covered by the above noted patent. This facility can be used to replace the power control function Immunity from single cell failures. The cyclic redundancy provided by the switching matrix dramatically improves reliability. This is very useful for mission critical applications. In electric vehicles (or aviation applications) it will always get you home. Improved accuracy of State of Charge (SOC) estimation. The cell voltage, which is one of the main parameters from which the SOC is derived, can be measured when the cell is in the open circuit condition and the chemical transformation in the cell has stabilised at the end of the rest period. This results in a more accurate measurement. Increased battery capacity. The capacity of the extra cell in the chain, the so called “redundant cell” is actually used to increase the capacity of the battery. Short term power boost As above, the redundant cell can also be used to provide an emergency power boost of 30% by switching off the cyclic redundancy and using the power of all of the cells in the chain. The cyclic redundancy is of course switched off during this boost.
Does not require a special charger Works with any standard charger designed for Lithium batteries.
Does not depend on technology breakthroughs. The battery can be realised using conventional hardware and software technology
Costs and Trade-offs The cost to provide all of these benefits is an increase of about 14% in the cost of the battery.
In principle, the technology can be used with any multi-cell battery of which billions are sold every year. The first generation products will be suitable for applications with power levels up to about 1kW and capacities up to about 2 kWh. This includes batteries used to power Light Electric Vehicles (LEVs) such as electric bikes, scooters and mobility aids, high capacity power tools, airborne surveillance drones, remote control models and motor control applications. Second generation products will be designed for higher power applications such as electric and hybrid electric vehicles (EVs and HEVs).
[1] The Electropaedia http://www.mpoweruk.com/life.htm Accessed 20/Jan /2012 [2] David Linden & Thomas B. Reddy: Pulse Charging , Handbook of batteries 3rd edition, Section 36.5.3 [6] The Electropaedia http://www.mpoweruk.com/chargers.htm Accessed 20/Jan /2012
Author
Barrie Lawson graduated with a degree in Electrical and Electronic Engineering from Birmingham University in 1964. He is Chairman of CHEEVC, a battery R&D company in Scotland. In his spare time he is the author of the Electropaedia at www.electropaedia.com, a web site about battery and energy technologies. Download a PDF copy of this paper See more details about reliability improvement through redundancy on the Reliability page Visit CHEEVC web site.
|
|||||||||||||||||||||||||||


![]() Print This Page || Home || FAQ || Site Map || Legal || Privacy Promise || Contacts
Print This Page || Home || FAQ || Site Map || Legal || Privacy Promise || Contacts
Woodbank Communications Ltd, South Crescent Road, Chester, CH4 7AU, (United Kingdom)
Copyright © Woodbank Communications Ltd 2005
